
Viewing a survey report
You can collect, measure, and review customer feedback with the survey report feature. The survey report can help improve your support team's performance with service industry quality measurements.
This video helps stakeholders get an overview of how to navigate and understand reports for Surveys for Jira Service Management. It covers the perspective of reviewing a support agent’s CSAT score over 2 months.
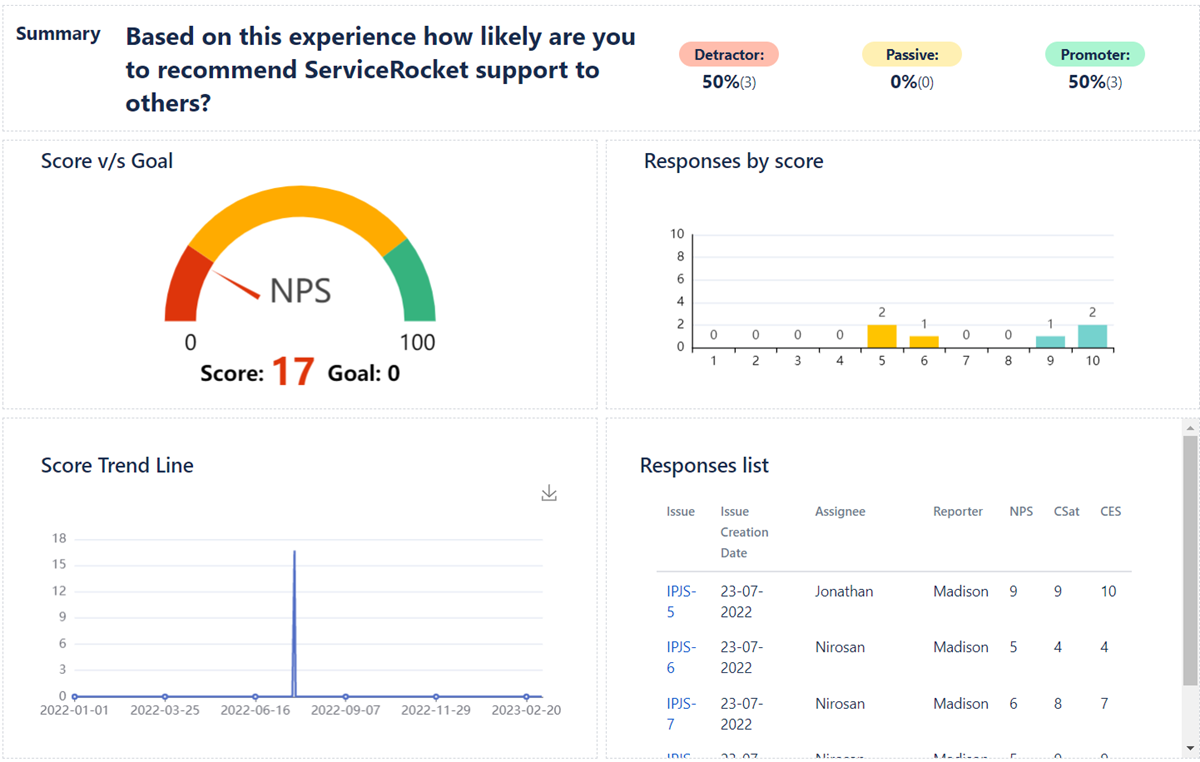
Sample survey report
Prerequisites
Before you can generate or view the survey reports, an administrator or manager must first grant the proper permissions to you.
Granting permissions
You will need to have the Administrators project role. Refer to the Manage service project role memberships documentation.
Displaying a survey report
Go to Projects > Choose your Service Management project > Surveys report.
At the top of the page, configure the survey report parameters to generate reports with varying data. For this example, let's generate a CSat survey report.
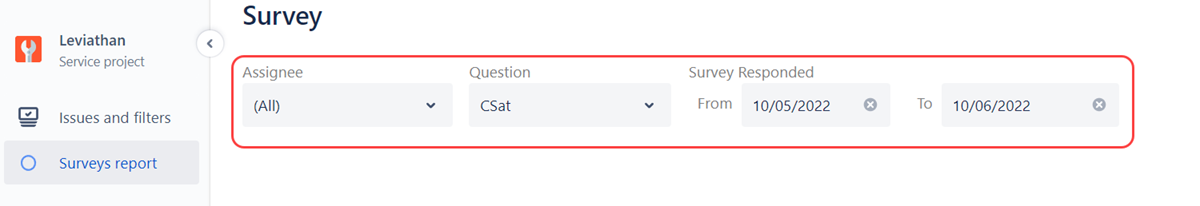
Select an Assignee by clicking on the dropdown or typing the assignee's name.
For the Question, choose the "CSat" option from the dropdown.
Then under the Survey Responded section, set the duration between two dates when the surveys have been answered by the customer. The page will load and display the charts and graphs below.
Viewing the survey report results
The Score v/s Goal gauge chart shows how the KPI of the individual/team is performing based on the benchmark set. 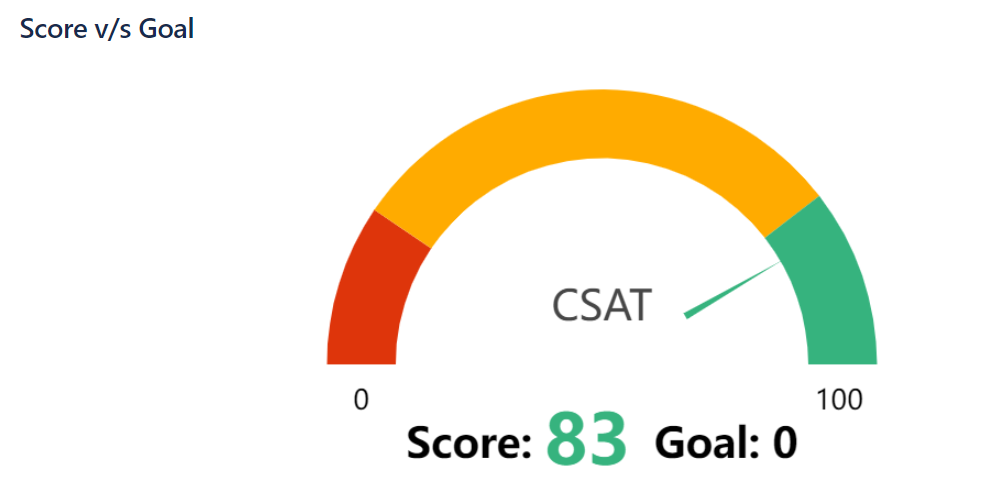
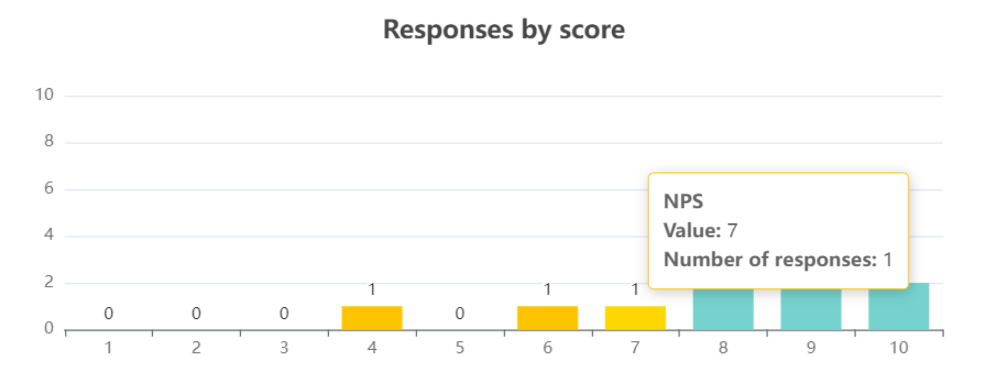
The bar chart is used to represent the Responses by Score section, the survey responses are grouped based on the score given. Hovering over the bars provides you with summarized details on each bar.
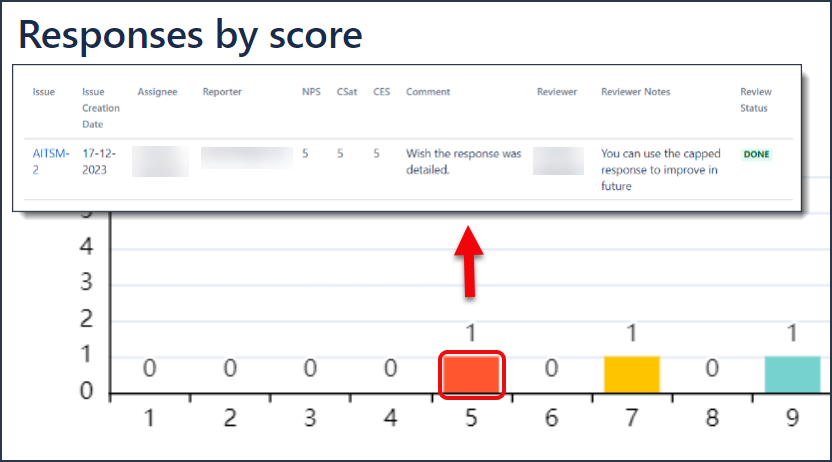
You can also click on the Response by score bars to get in-depth insights of a particular result:
The Group By feature is currently unavailable. We are now working to fix this.
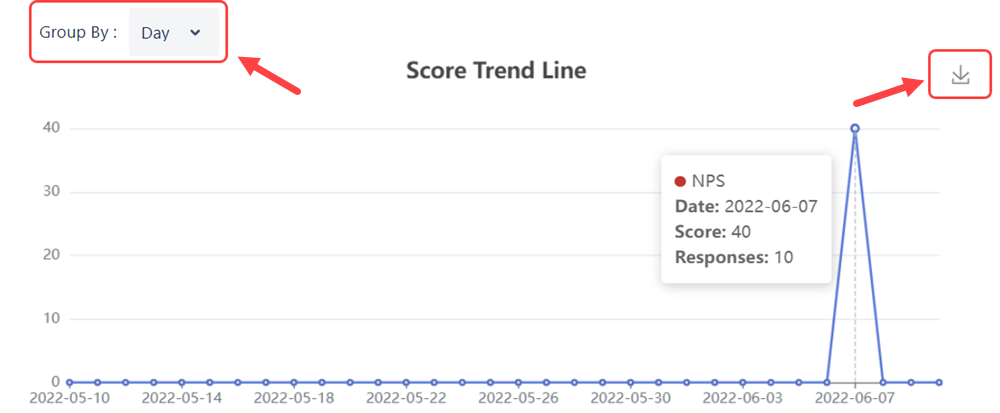
The line graph is used to represent the Score Trend Line section:
Filter the trend duration (Day, 2 Days, Week, Month) with the Group By dropdown.
Click the download icon to save the line graph as an image.
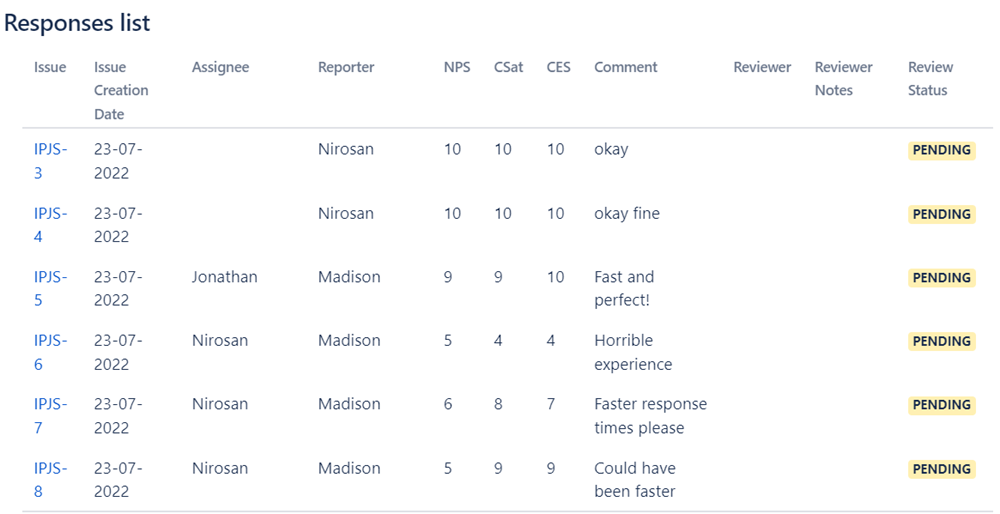
The Responses list section details the issues with survey responses that were used to tabulate the data in the charts. Click the issue key to view the issue on a project level.
Exporting survey report
At the top of the page, you will have two options:
Export: This will export the data as seen in the survey report screen. This option will only export the current scale.
Export All: This will export all data, regardless of the scale, for the selected timeframe.