
End-of-Life Notice: Surveys for Jira Service Management will be discontinued on October 30, 2026. After this date, the app will be removed from the Atlassian Marketplace and will cease to function. To ensure a smooth transition, please export your survey data and explore alternative solutions before the sunset date.
You can retrieve your survey responses via API or export from CES, CSAT and NPS reports via the Export All Scales feature.
Prerequisites
Before you can generate or view the survey reports, an administrator or manager must first grant the proper permissions to you.
Granting permissions
You will need to have the Administrators project role. Refer to the Manage service project role memberships documentation.
Report summary
Understanding customers' satisfaction with your organization's service or products is a key marker in the service industry business. The Customer Satisfaction (CSat) report allows you to measure how satisfied a customer is with the service you have provided.
Report type
Gauge chart, bar chart, and trend line graph
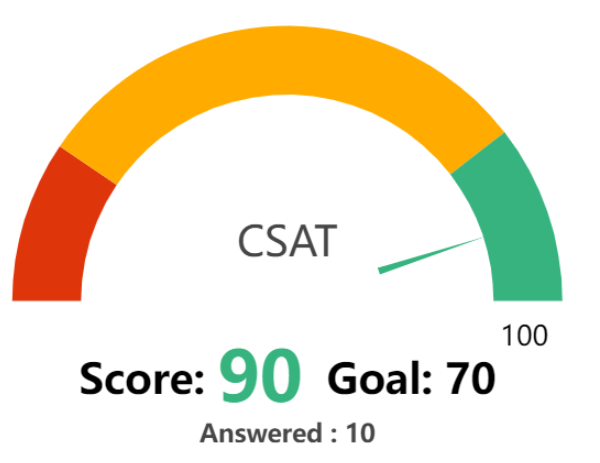
Gauge chart metrics
|
Metric |
Details |
|---|---|
|
Score |
The total score based on the average score of the accumulated survey answers received. |
|
Goal |
The set goal of the team to measure the individual's/team's performance. |
|
Answered |
The total number of surveys answered by the customers. |
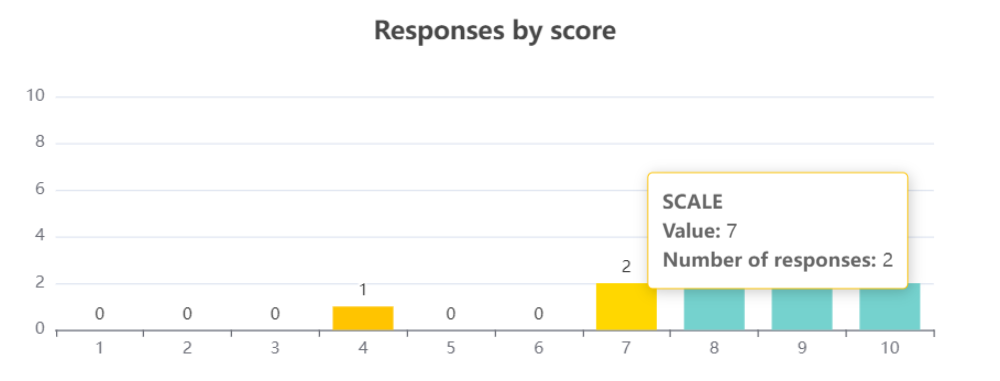
Responses by score metrics
|
Metric |
Details |
|---|---|
|
Value |
The specific score given by the customer for a Jira Service Management survey. |
|
Number of responses |
The total number of responses with the same score. |
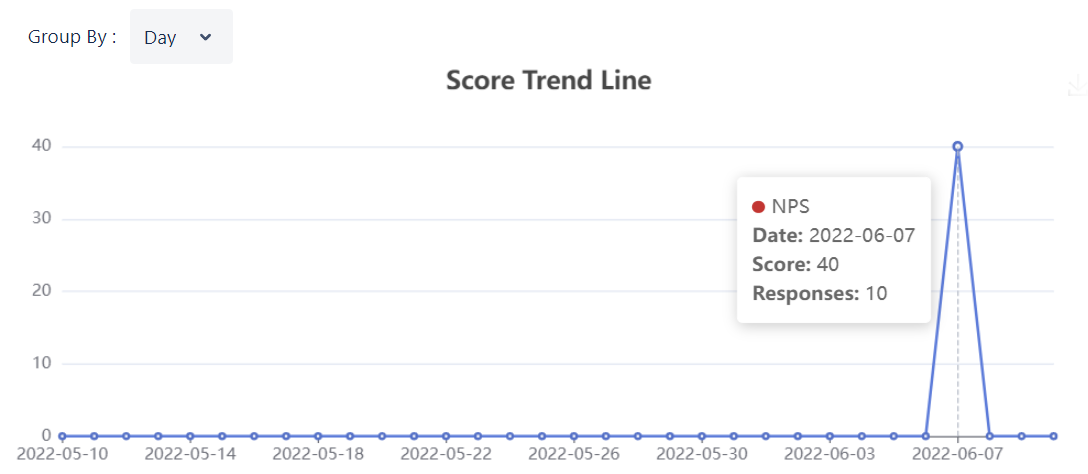
Score trend line metrics
|
Metric |
Details |
|---|---|
|
Score |
The total score accumulated over a specific duration. |
|
Responses |
The total number of responses received on a specific duration. |
Scenario
You would like to know the Customer Satisfaction (CSat) of a service desk agent in a specific timeline.
-
Go to Projects > Choose your Service Management project > Surveys report
-
Configure the survey parameters with the following details, the page will load the results automatically:
-
Assignee - Choose a specific assignee to view their performance or choose all of the assignees to view the performance as a team.
-
Question - Choose the CSat option.
-
Survey Responded - Set the duration for when a survey is responded to and collected.
-
-
The results and scores will be depicted in charts and graphs. The Responses section will include all issues used to tabulate the data.
-
You can export the data in the following ways:
-
Export: This will export the data as seen in the survey report screen. This option will only export the current scale.
-
Export All: This will export all data, regardless of the scale, for the selected timeframe.
-