Viewing a list of issues from a report
Issues are often represented as graphs and charts in a report to help give you an overview of the data points. By drilling into the exact issue, you are able to track what issue contributes to the report's data.
This guide helps you to view the issues from the report shown in the support dashboard.
Steps
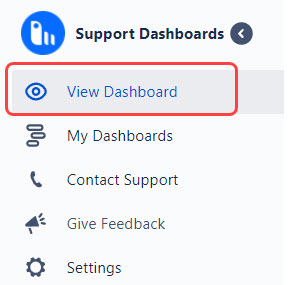
- In the Support Dashboards interface, click on View Dashboard.
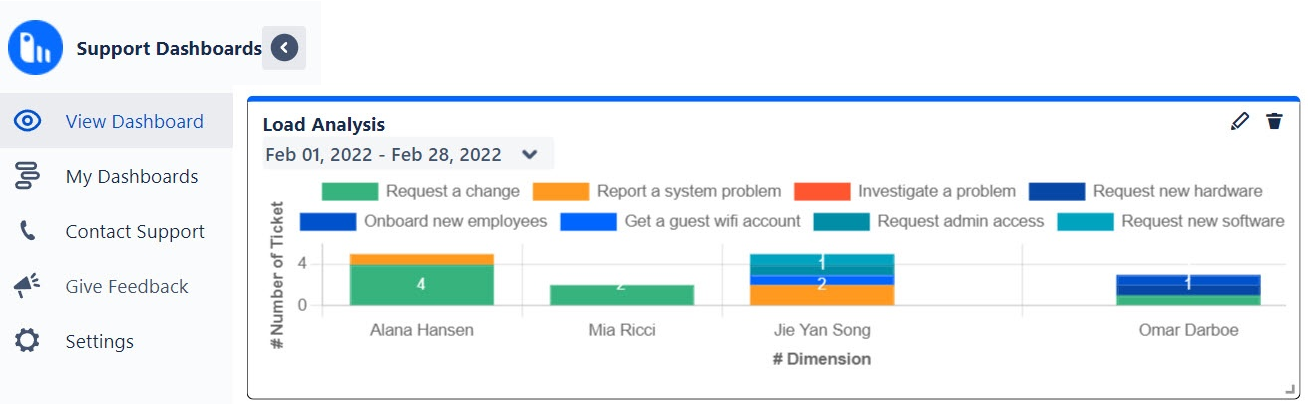
- You will see your default dashboard with the reports that you have created.
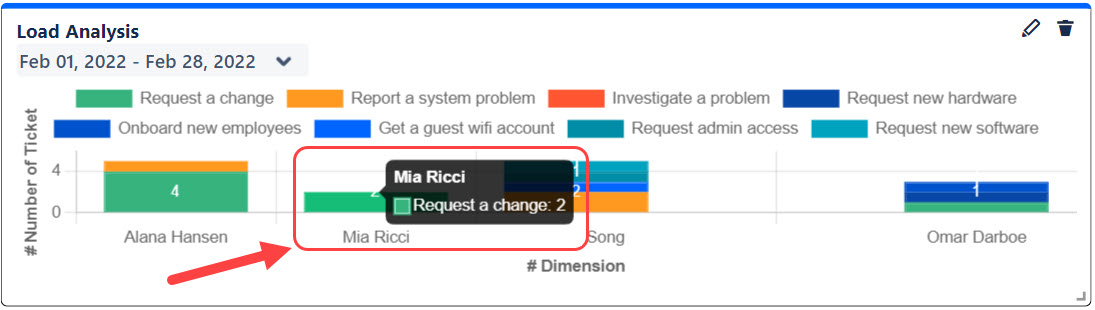
- Hover on any of the colored bars, a small pop-up will appear summarizing the report's data. In this example, the data point "Mia Ricci" is chosen.
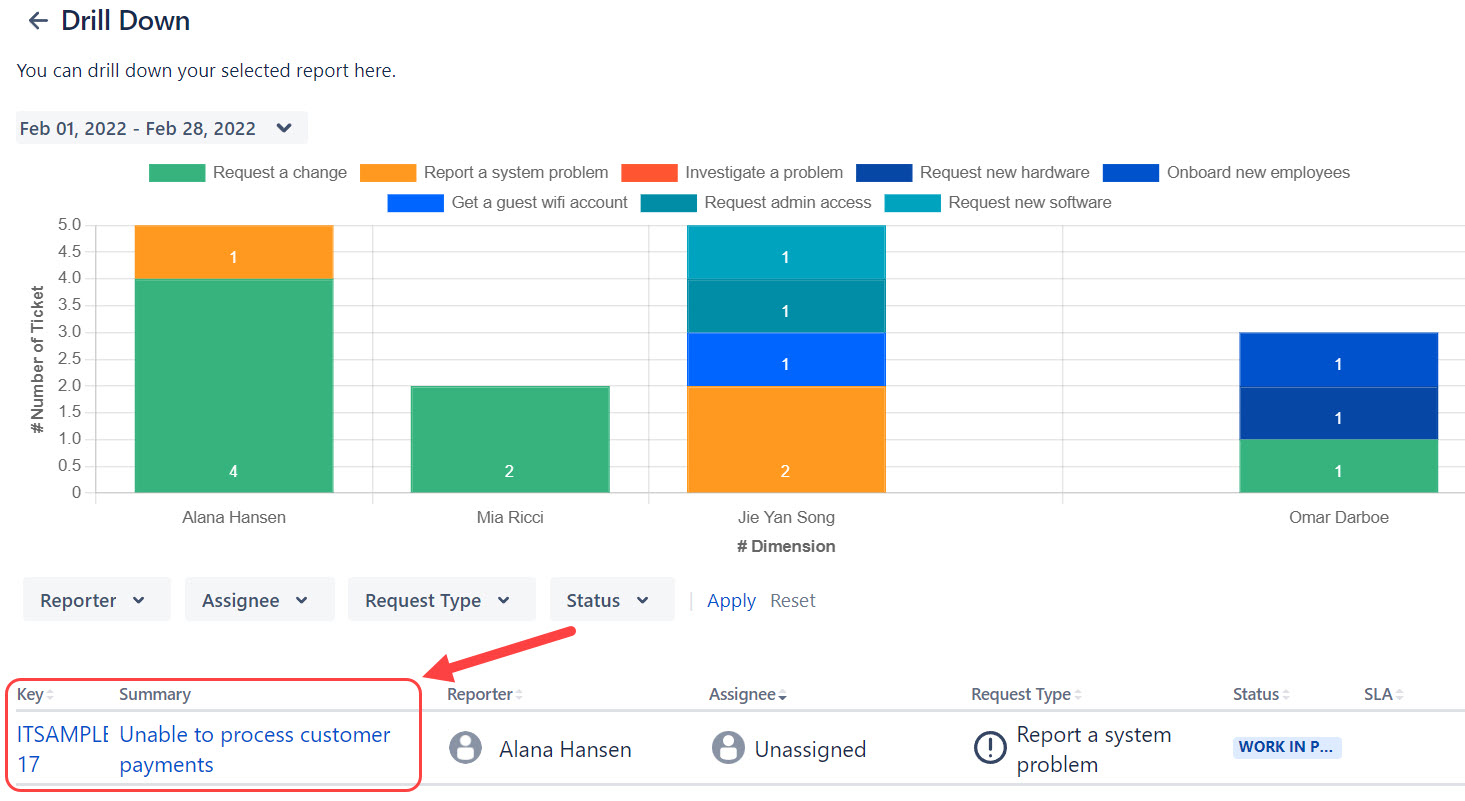
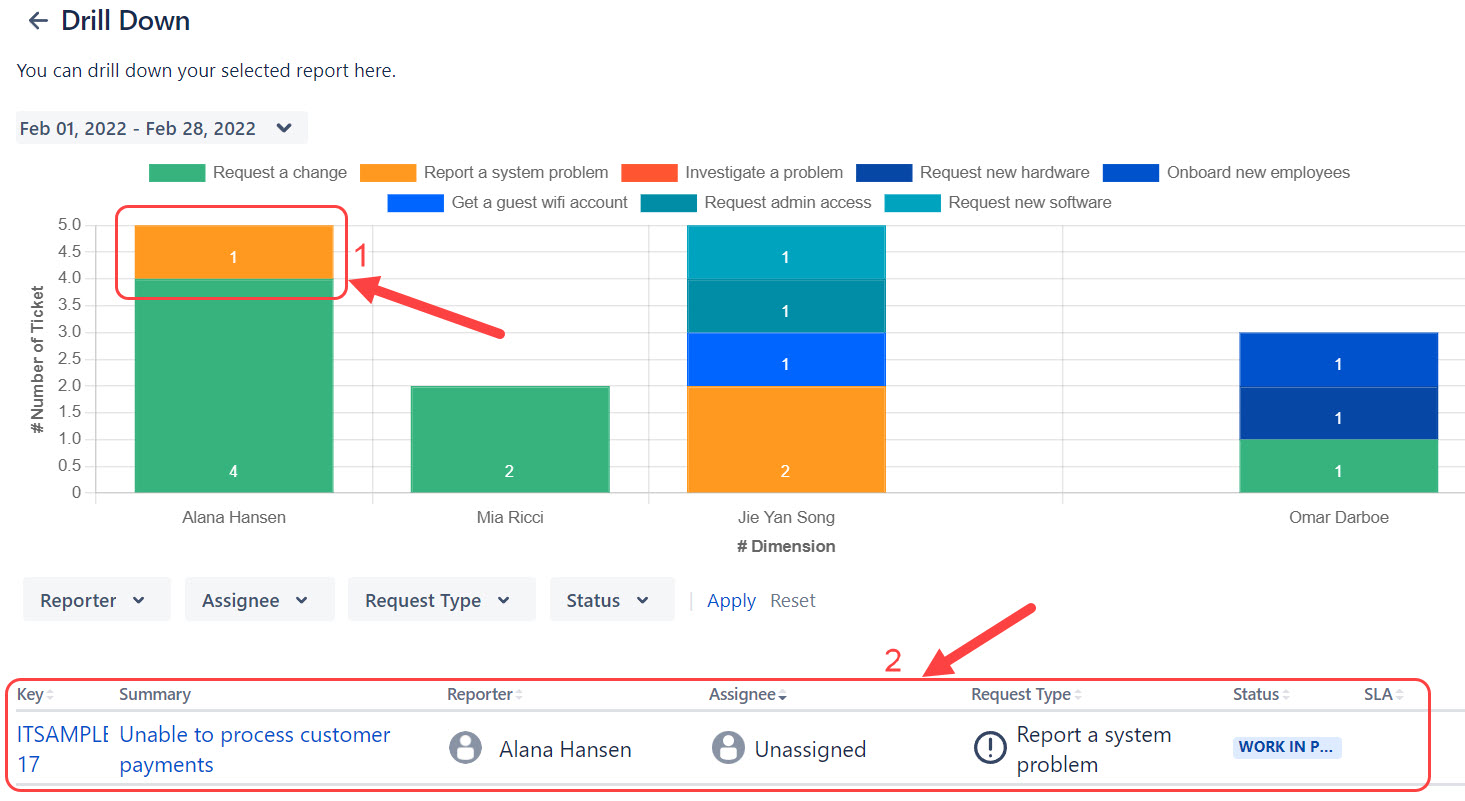
- Click on any of the colored bars, you will be brought to a new page. The data shown on the new page will be based on which colored bar you have clicked on.
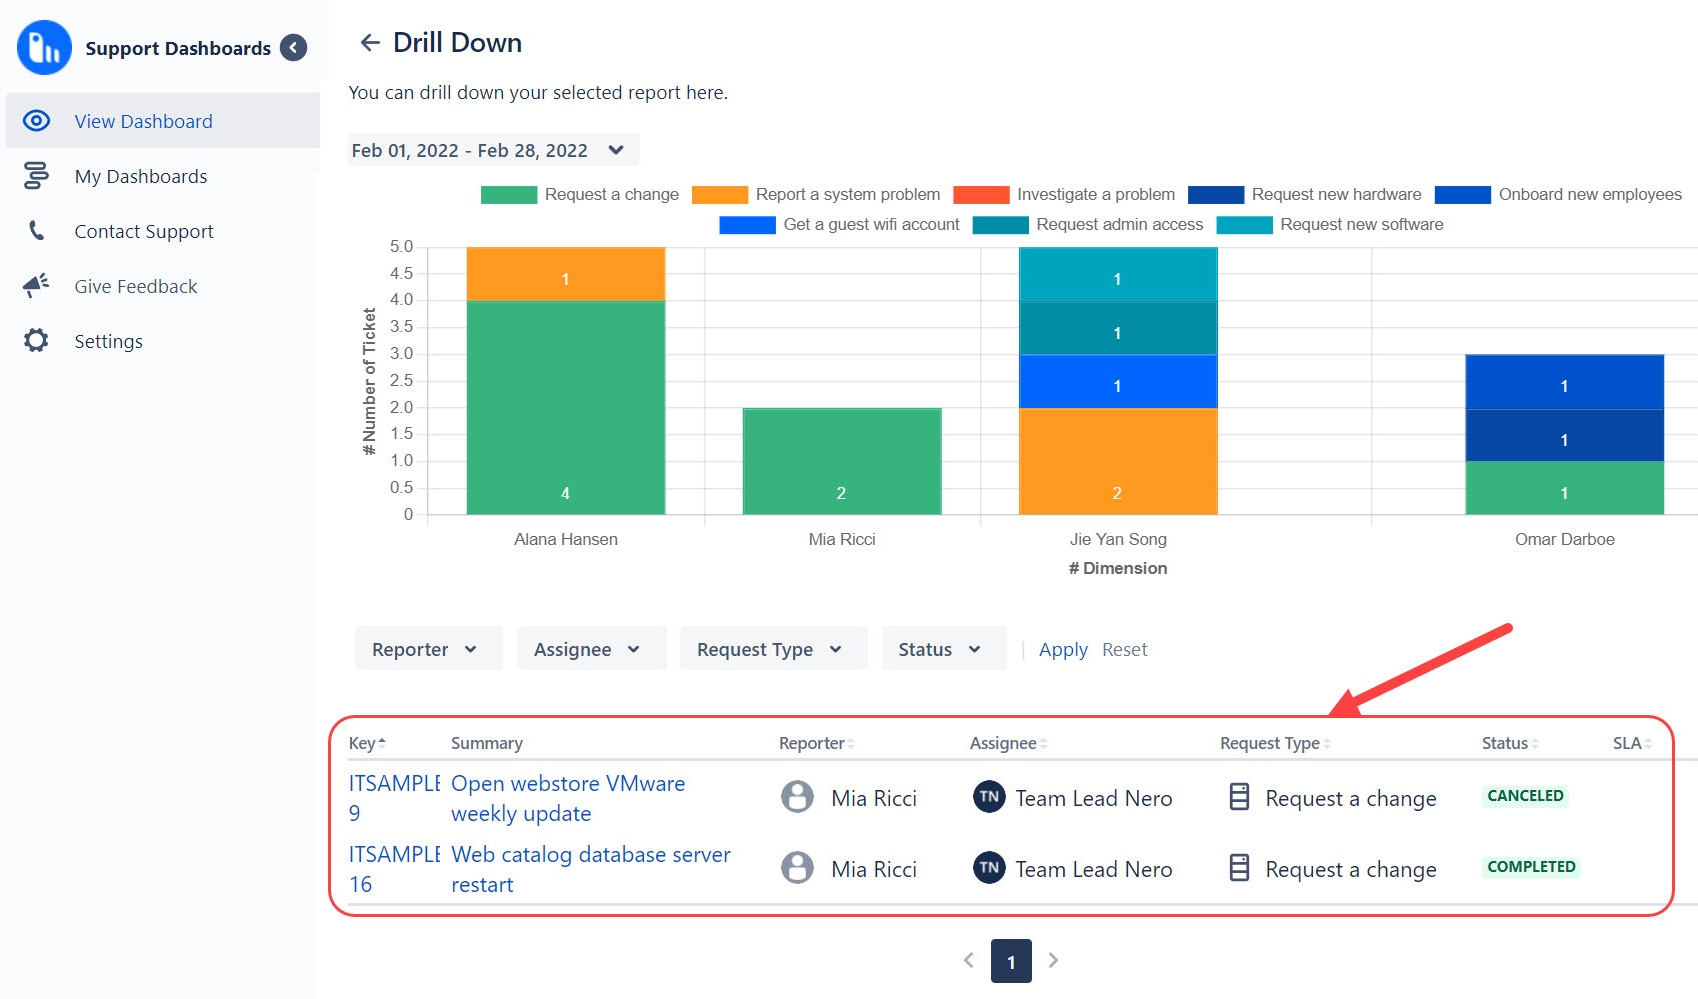
- Click on the other colored bars to change the issue viewer's content.
- Click on the Issue Key or the Summary to view the issue on a project level.