Quick start
This is a quick start guide to working with Support Dashboards Reports for JSM. The Jira Service Management has many features that work together for a report to be created. This guide will simplify this process and allows you to quickly generate your very first report.
In this example, we will generate a report that provides you with an overview of the total issues raised by customers in a project.
Prerequisites
Before you can create or view reports, an administrator or manager must first grant the proper permissions to you.
This step is covered under the administrator guide section, on the Configuring the app page.
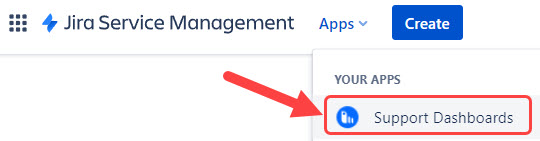
Step 1 - Open the Support Dashboards page.
- Click on Apps > Support Dashboards.
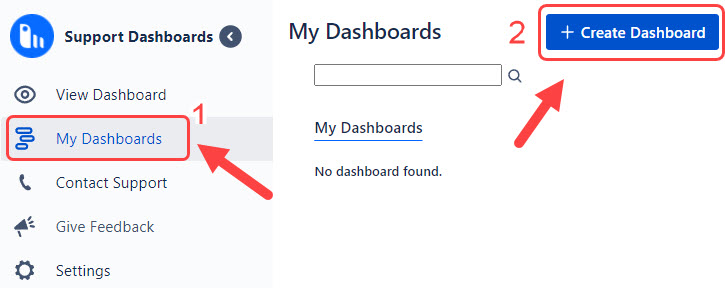
- Click on My Dashboards if you haven't already landed on the page. Once the page loads, click on the Create Dashboard button.
Step 2 - Create a report
- You will be brought to the View Dashboard page; click on the Create Report button.
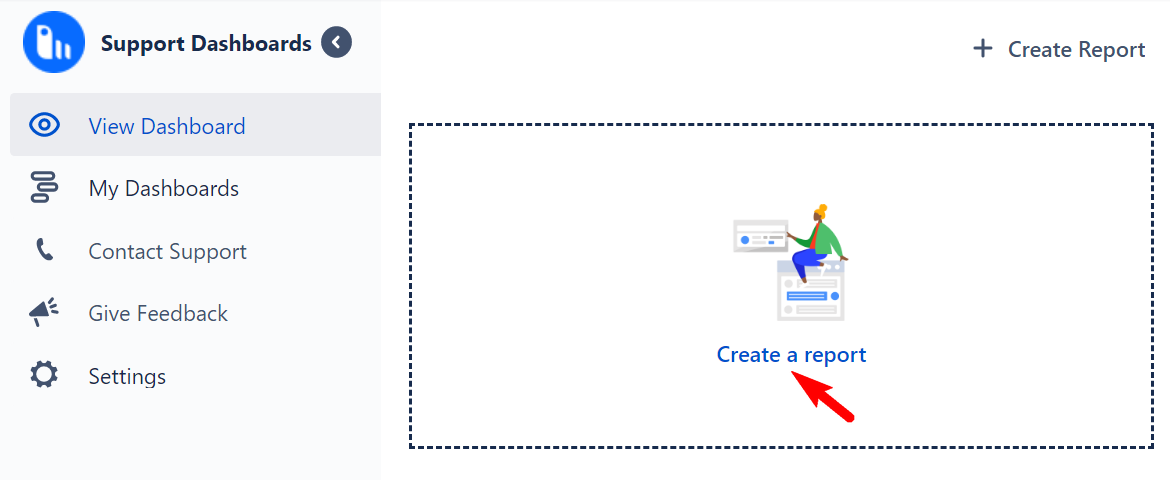
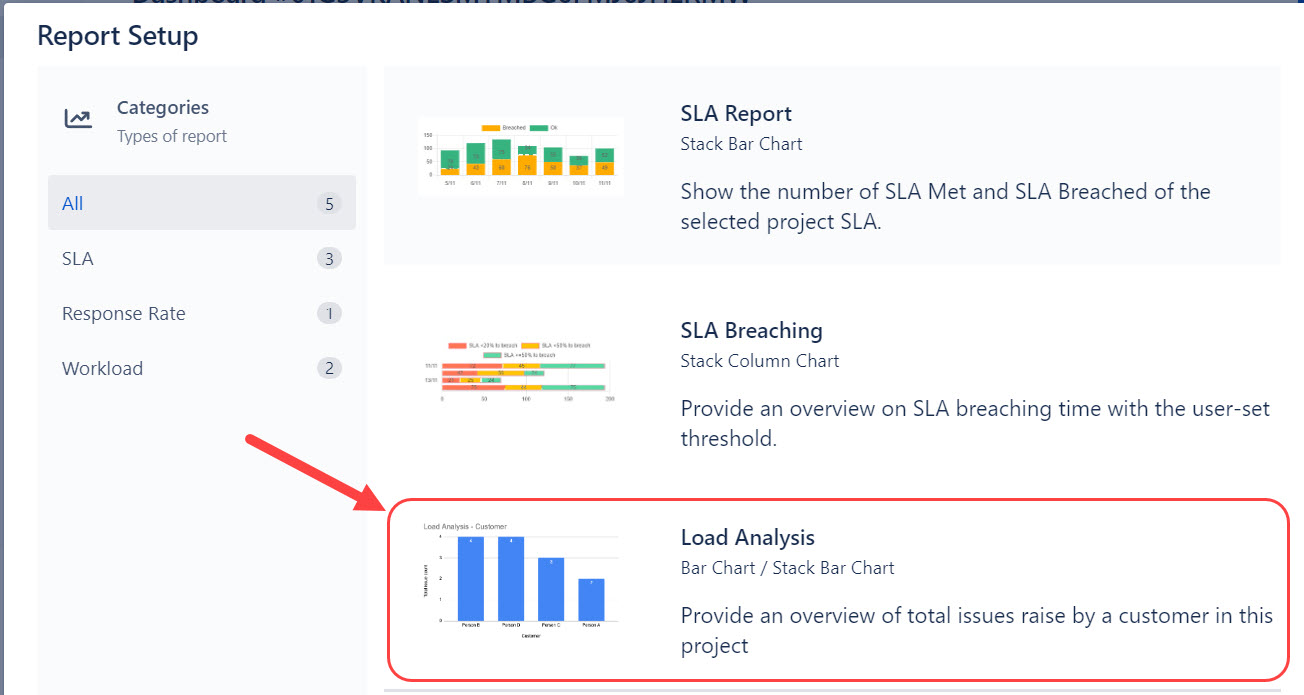
A pop-up will appear, scroll down, and click on the Load Analysis report.
- In the Report Setup display, you can fill in details relevant to your requirements and then click on the Save button.
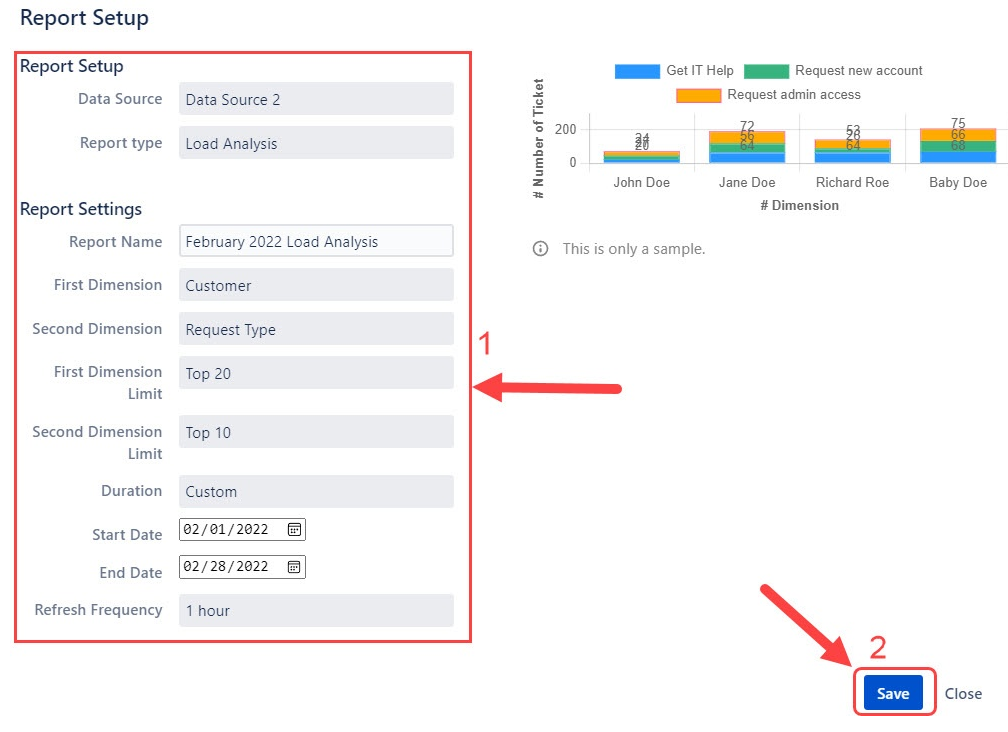
- In the Data Source dropdown pick a data source that is linked to the project(s) you are working on.
- In the Report Type use the Load Analysis report type that is pre-filled.
- In the Report Name textbox type in the name for your report. For this example, we will be pulling data from the month of February 2022, thus naming it "February 2022 Load Analysis".
- In the First Dimension dropdown, choose "Customer".
- In the Second Dimension dropdown, choose "Request Type".
- In the First Dimension Limit dropdown, set the highest limit for the number of customers. For this example, we'll set it as "Top 20".
- In the Second Dimension Limit dropdown, set the highest limit for the number of request types. For this example, we'll set it as "Top 10".
- In the Duration dropdown, choose the relevant timeline to which you'd like to see represented in the report. For this example, we'll choose a custom duration with a "Start Date" and "End Date" for the month of February.
- In the Refresh Frequency Limit dropdown, set the time needed for the data in the report to refresh to show the latest results. For this example, we'll set it to "1 hour".
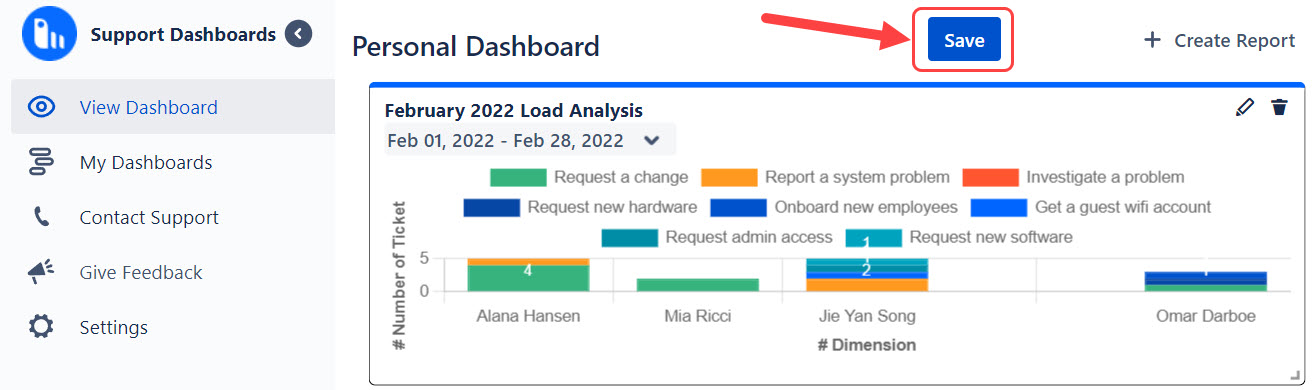
Step 3 - Save the dashboard
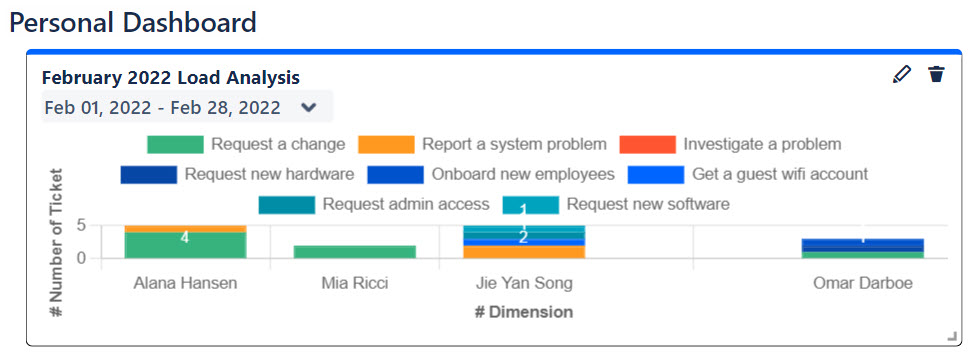
Once the report has been created, the report will appear in your newly created dashboard.
The dashboard name is predefined, click on the dashboard's predefined name and change it to your own preference.
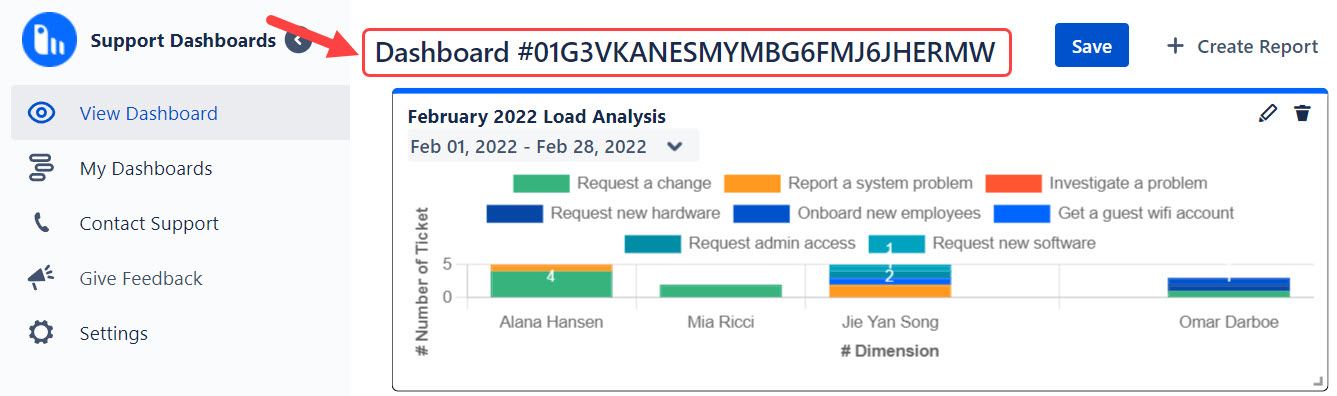
- For this example, we'll name the dashboard, "Personal Dashboard". Finally, make sure to click on the Save button to confirm all changes. Well done! You have created your first of many reports.