
Integrating with third-party platforms Webhook
Splunk
Set up Splunk to receive the logs, including time-stamped events, to HTTP Event Collector using the Splunk platform JSON event protocol.
Setting up splunk integration
Navigate to Settings > Apps > Guard Dog Relay for Jira.
Add your Webhook URL to the Webhook Relay application configuration page.
Create a Webhook Listener in Jira:
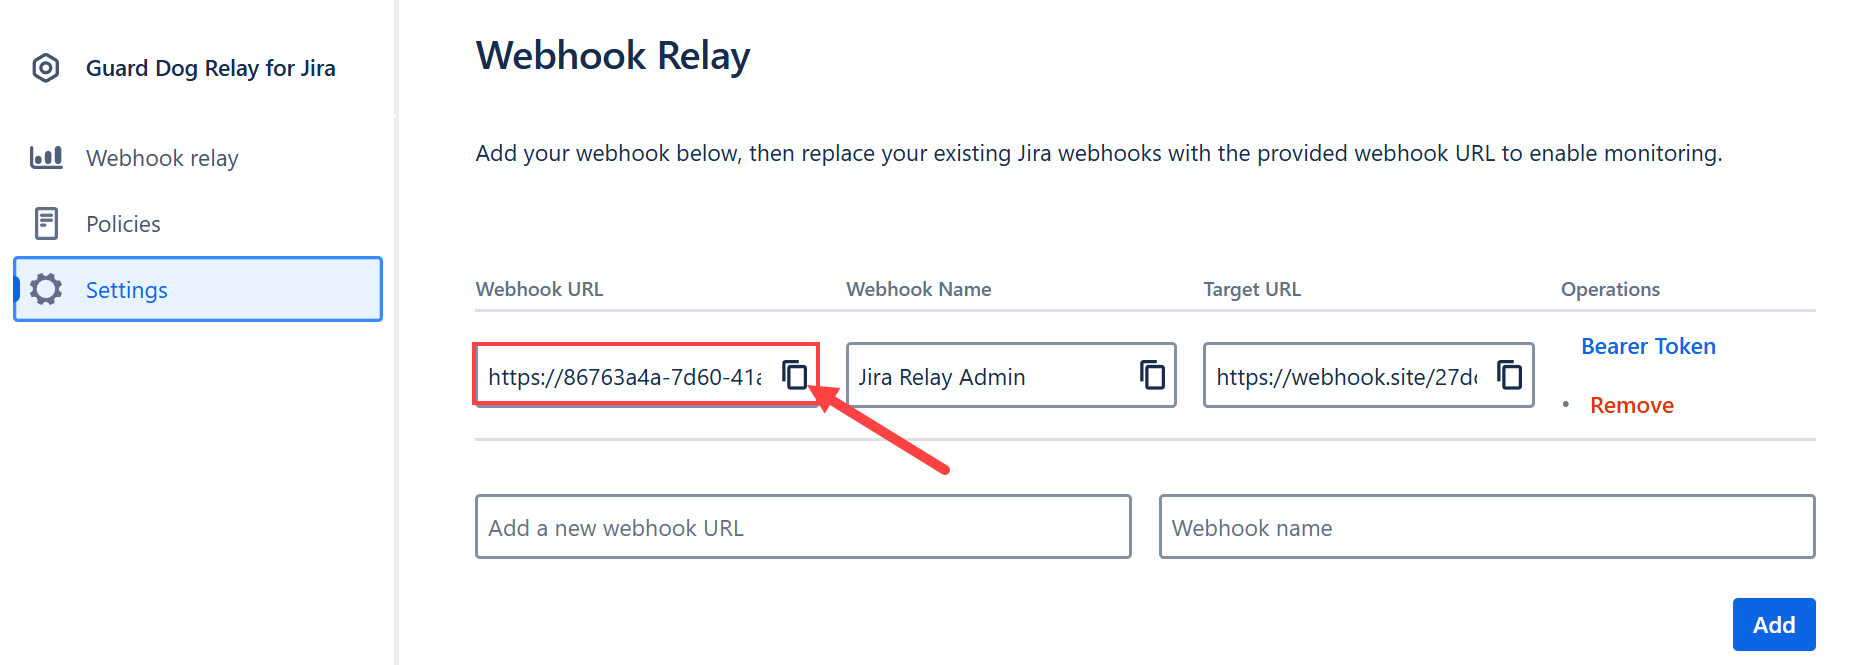
In Guard Dog Relay for Jira, go to Settings and scroll down to the Webhook Relay section. Copy the webhook URL.
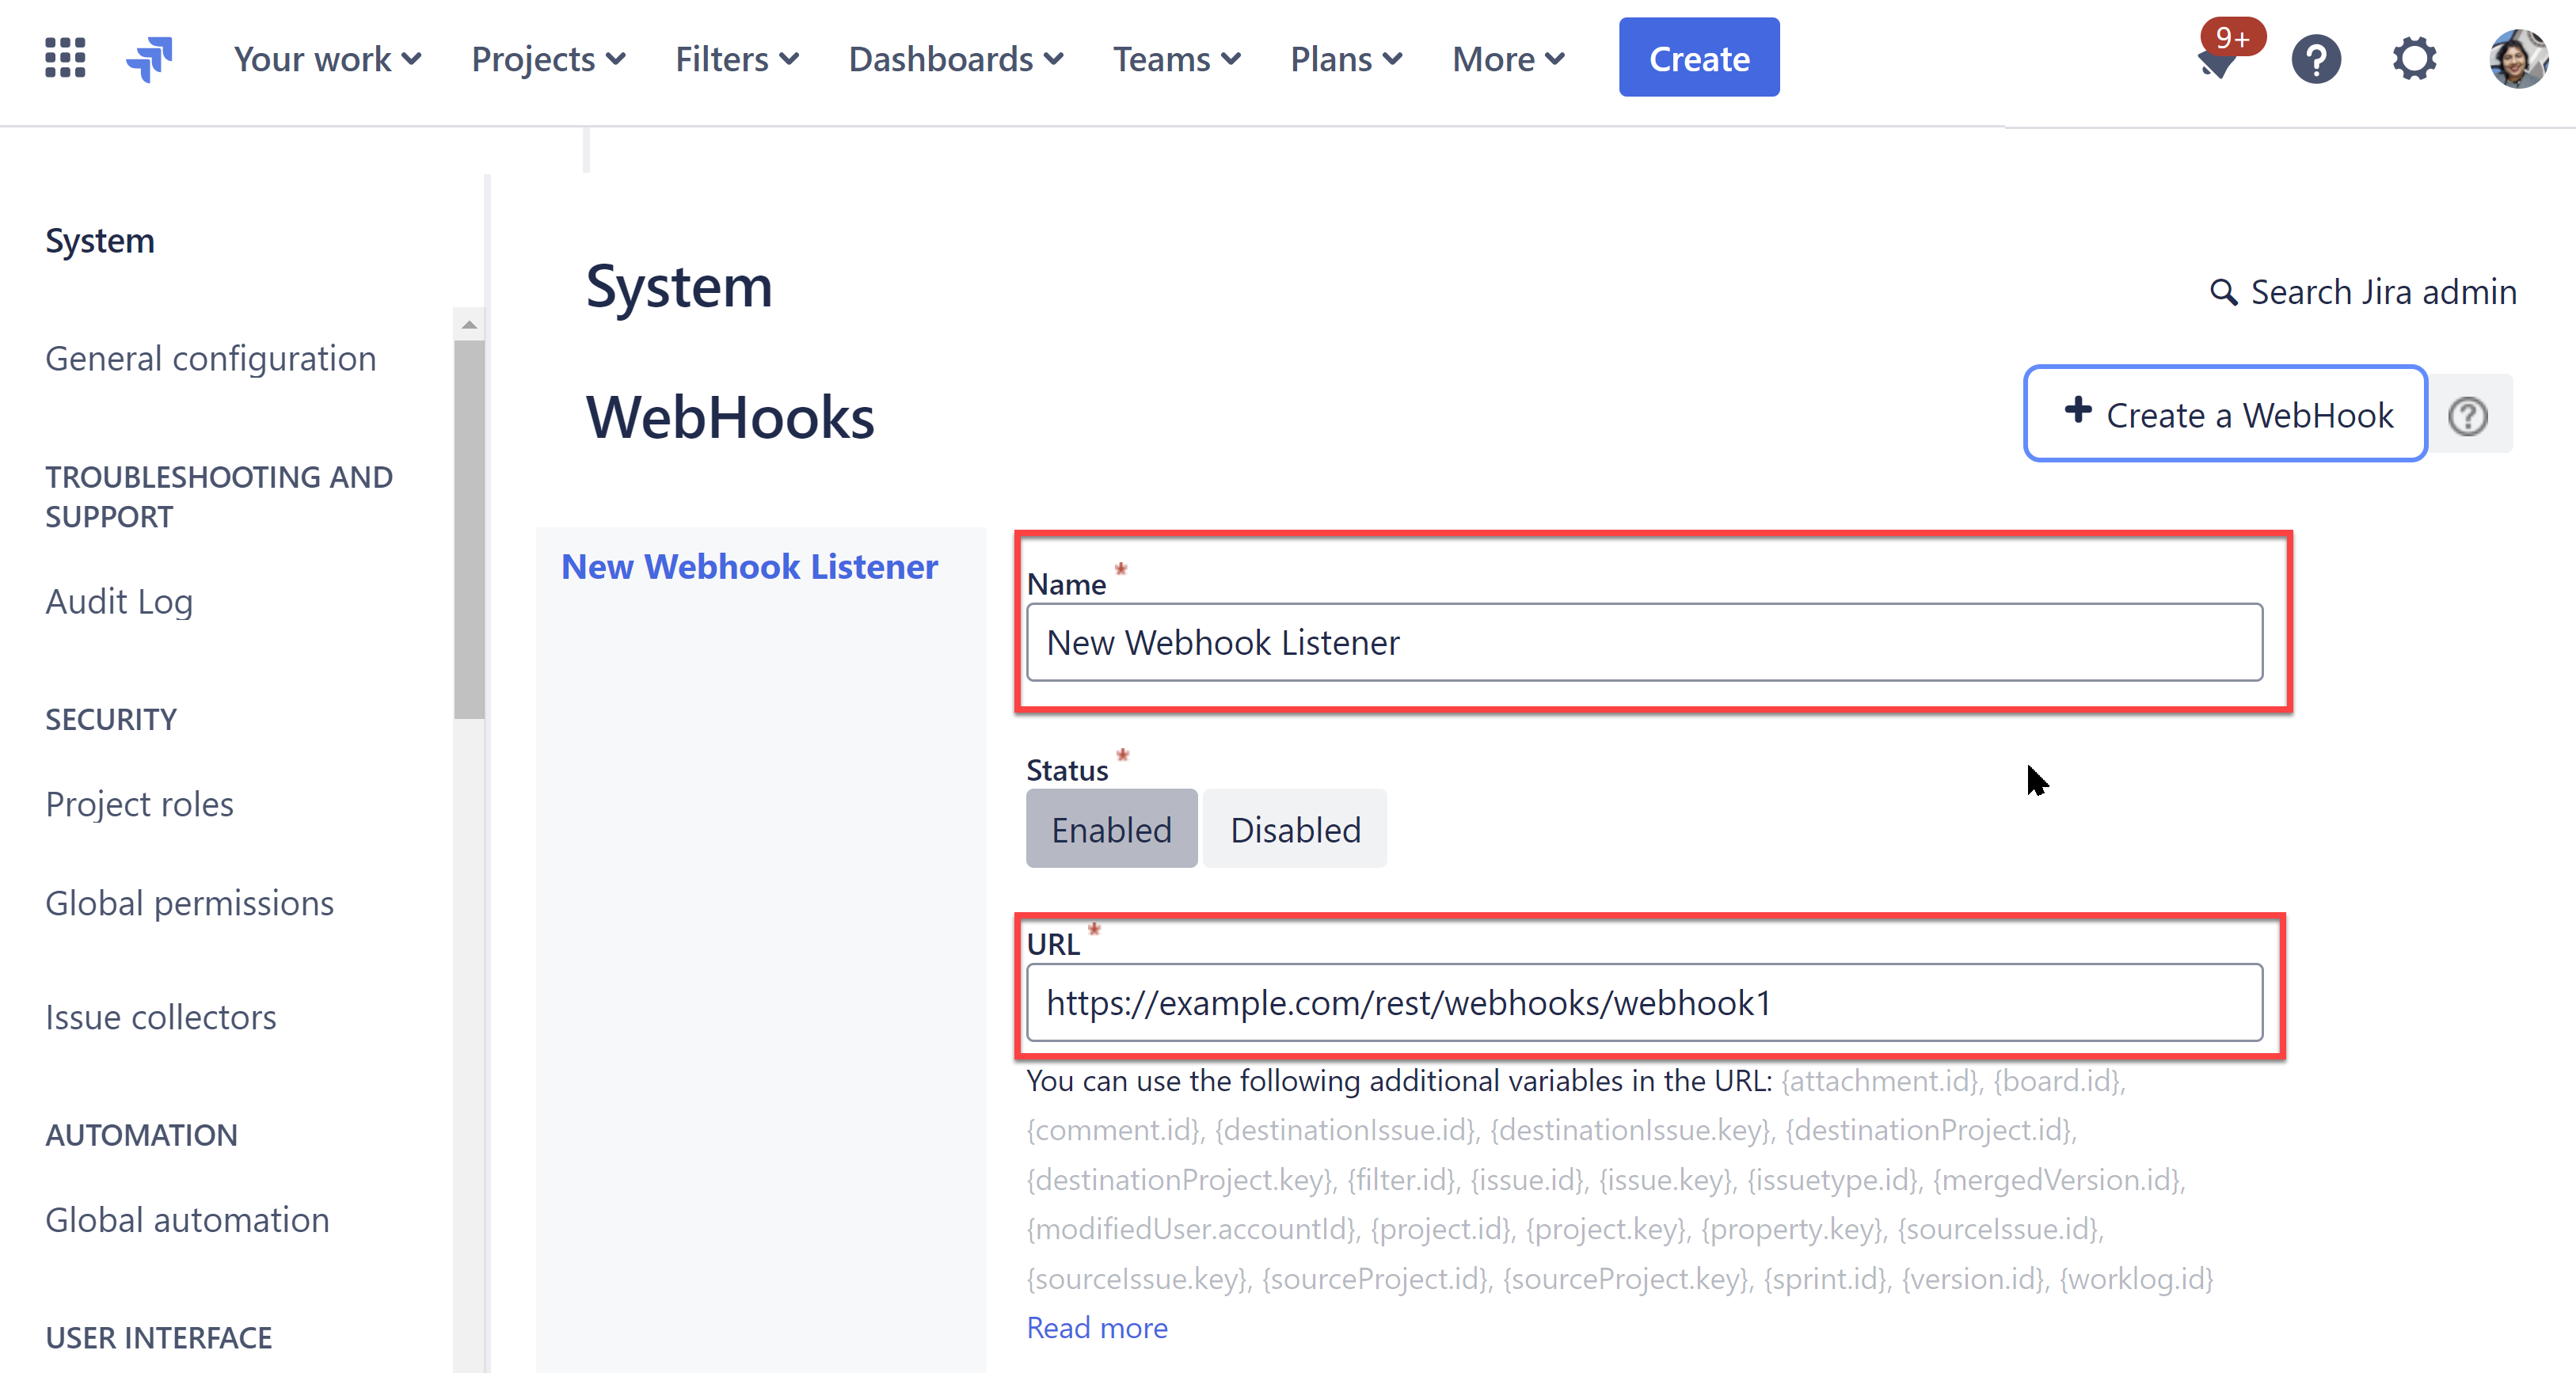
Then, navigate to Jira settings > System > Advanced > Webhooks.
Create a new Webhook Listener by naming it and pasting the webhook URL obtained in step 3a.
Here’s an example of how we assign JQL issue-related events.
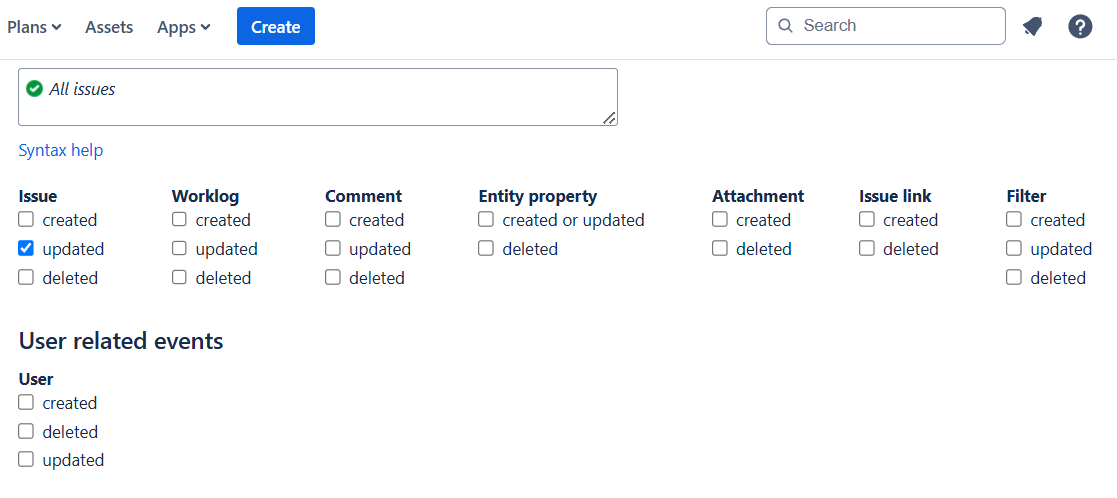
Click Create to finalize.
Create an HTTP event collector token in Splunk Enterprise:
Refer to the Splunk Documentation for the latest setup instructions tailored to your environment’s needs for configuring this event collector.
Below is a basic example of how one of our engineers successfully set up the event collector.
Ensure you have your Splunk instance ready.
Navigate to the Settings menu, then select Add Data to begin configuring the data you wish to send to Splunk.
Enable data flow
Choose Monitor to allow data to flow through your Splunk instance.
Set up HTTP event collector:
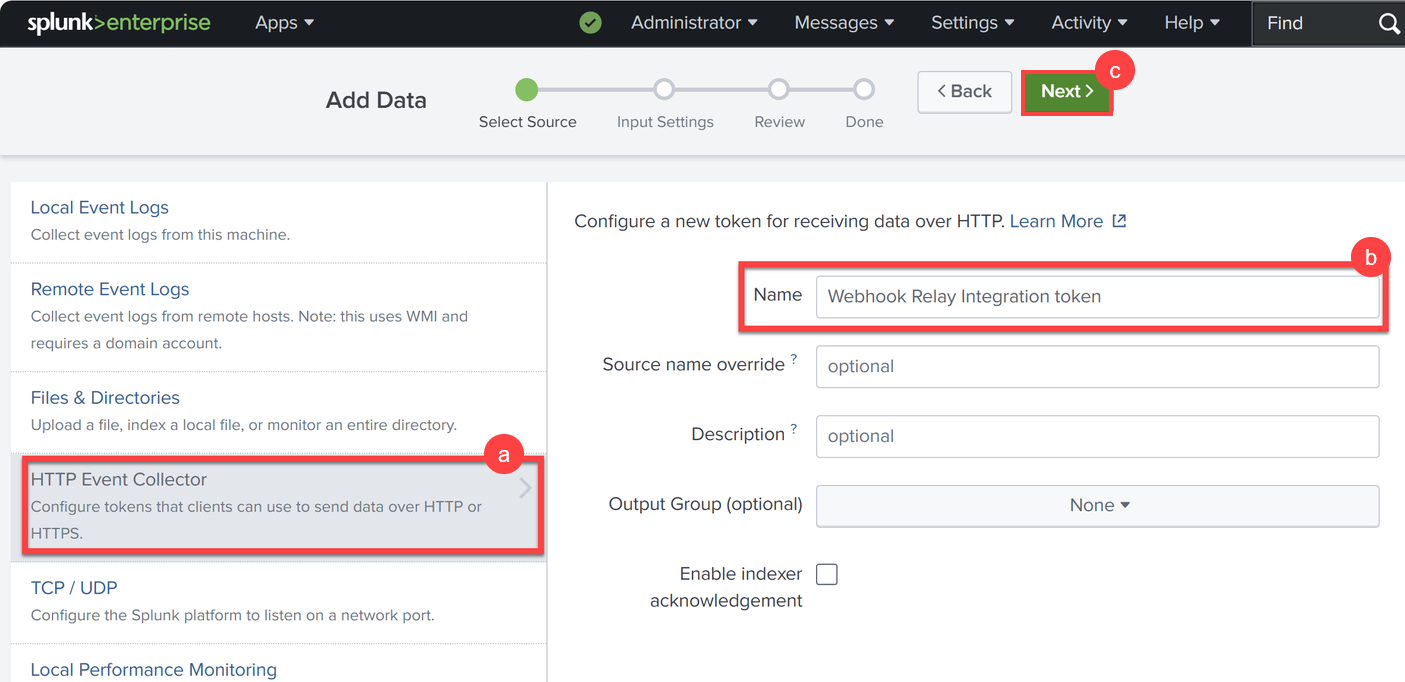
Navigate to the HTTP Event Collector section.
Fill in the Name field for the new token.
Click Next > Review > Submit to generate the token.
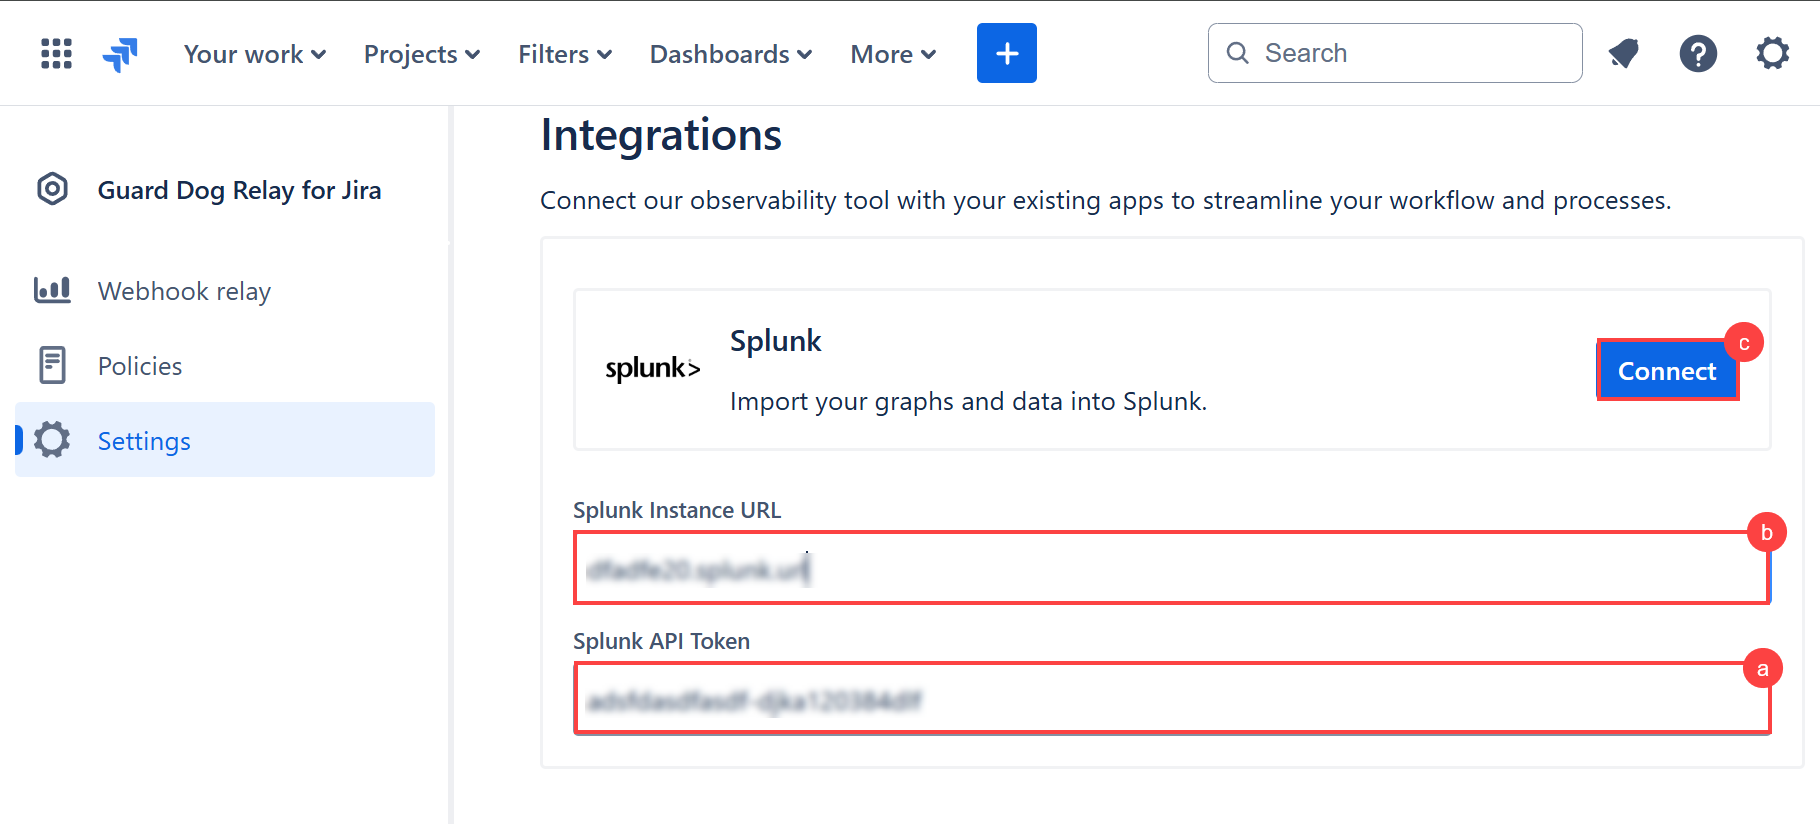
To configure the application, in Guard Dog Relay for Jira > Settings and scroll down to the Integrations section. In the Splunk settings:
Paste the token generated in step 4c in the Splunk API Token field.
Enter your Splunk instance URL.
Click Connect to establish the connection between your application and Splunk.
Testing the integration
Trigger an event:
Update an issue by changing its workflow status. (See example below.)
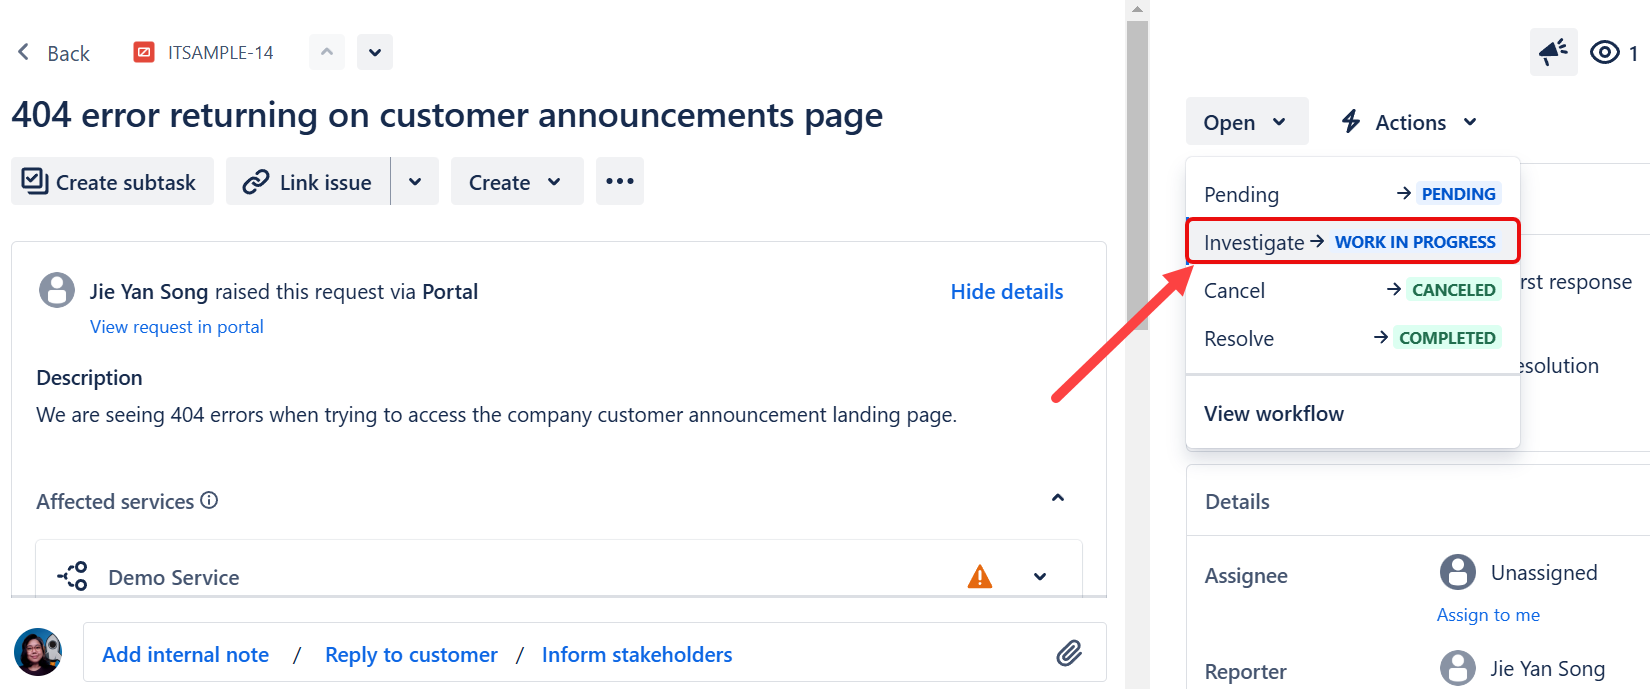
Verify in Splunk:
Go to Splunk and check that the log has been captured as a record, confirming successful integration.
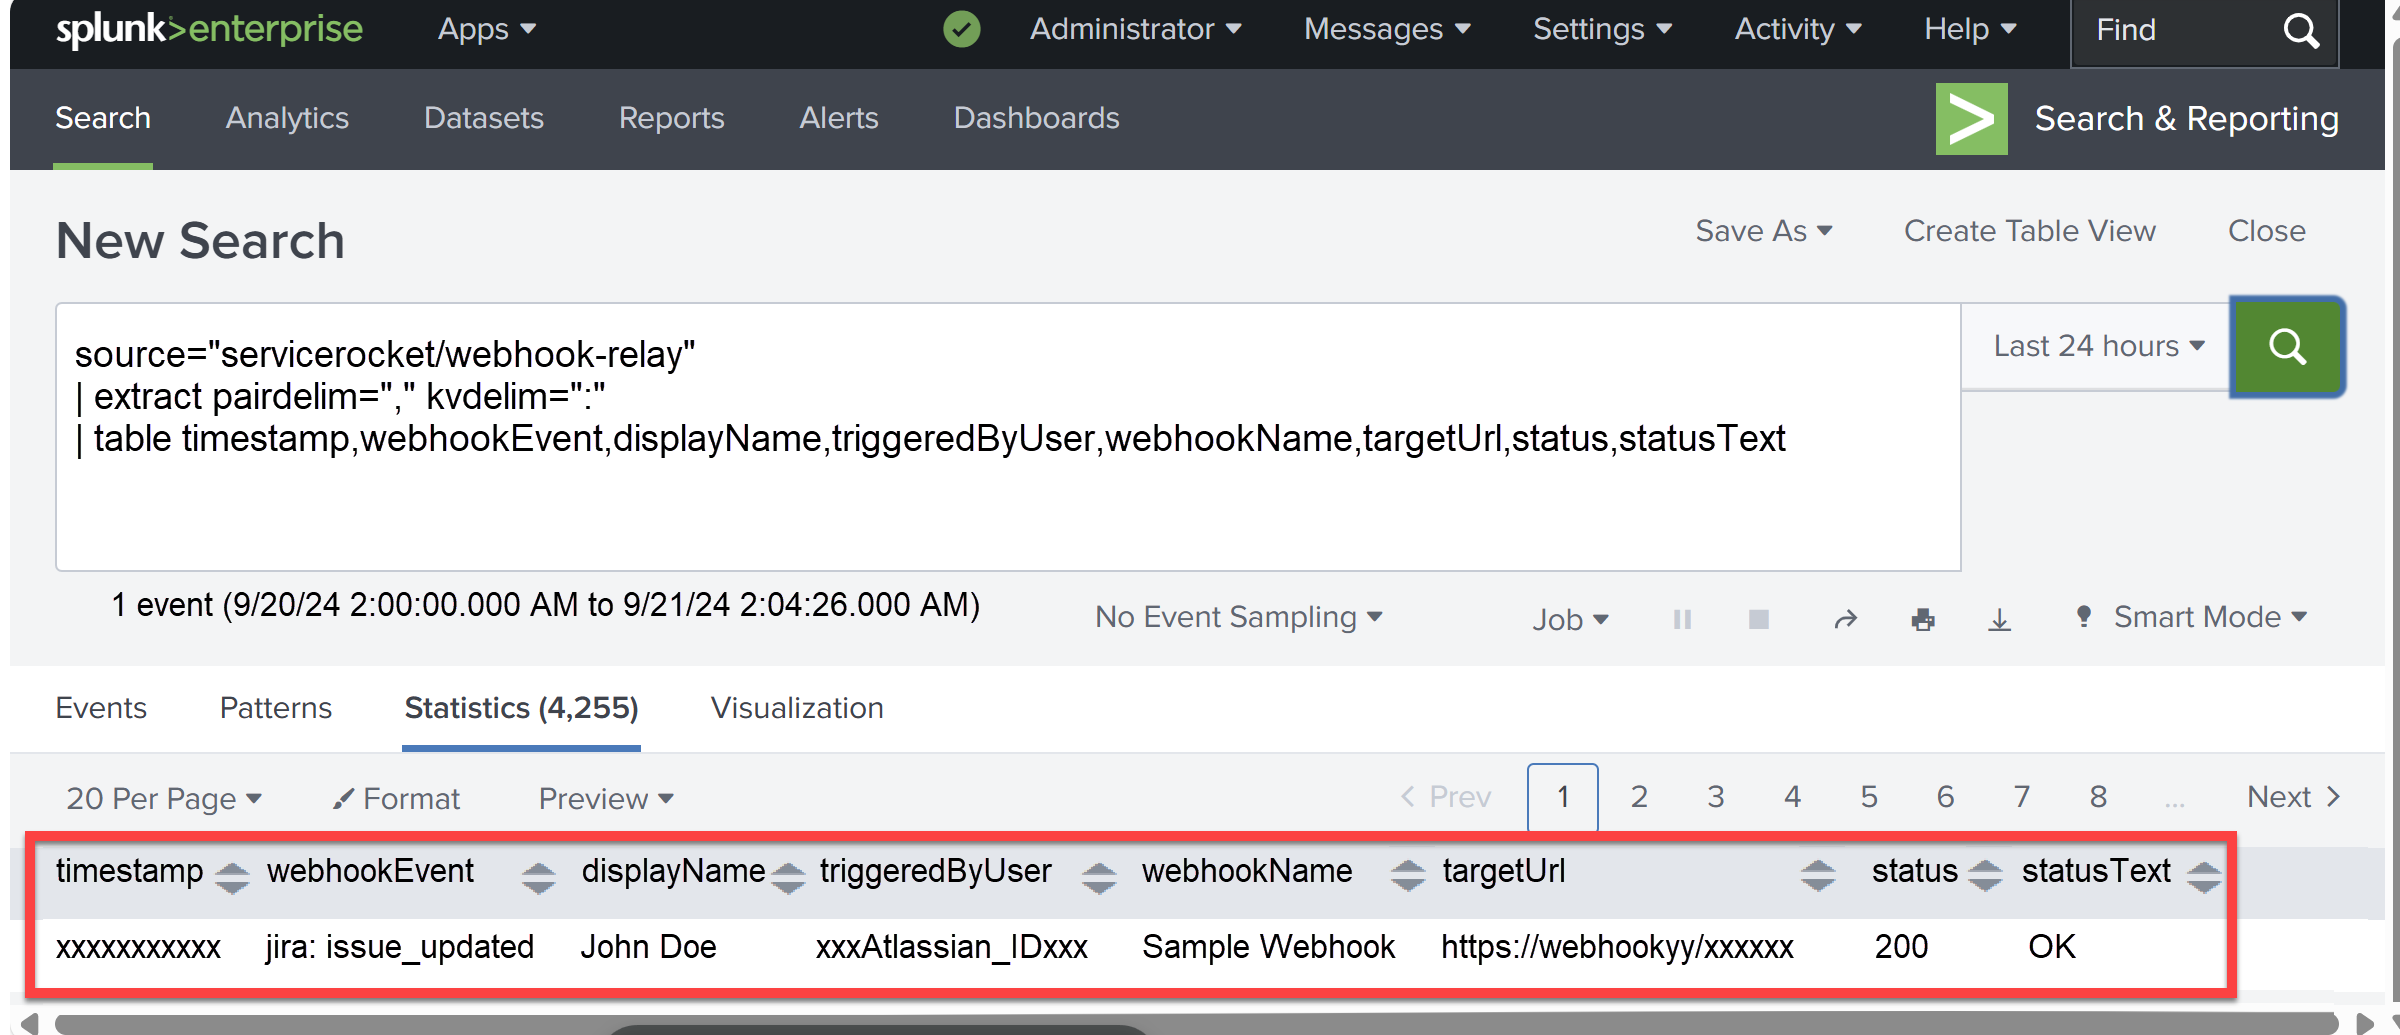
The above example shows a successful update of the update JQL in the previous steps.
Logstash
Logstash is an open-source data processing pipeline that collects, processes and forwards logs or other types of data to various outputs. It's often used to aggregate and transform logs from different sources before sending them to systems like Elasticsearch, Splunk, or other databases for storage and analysis. Logstash allows for real-time data processing and supports a wide range of input, filter, and output plugins, making it highly versatile for managing log data.
Setting up Logstash integration
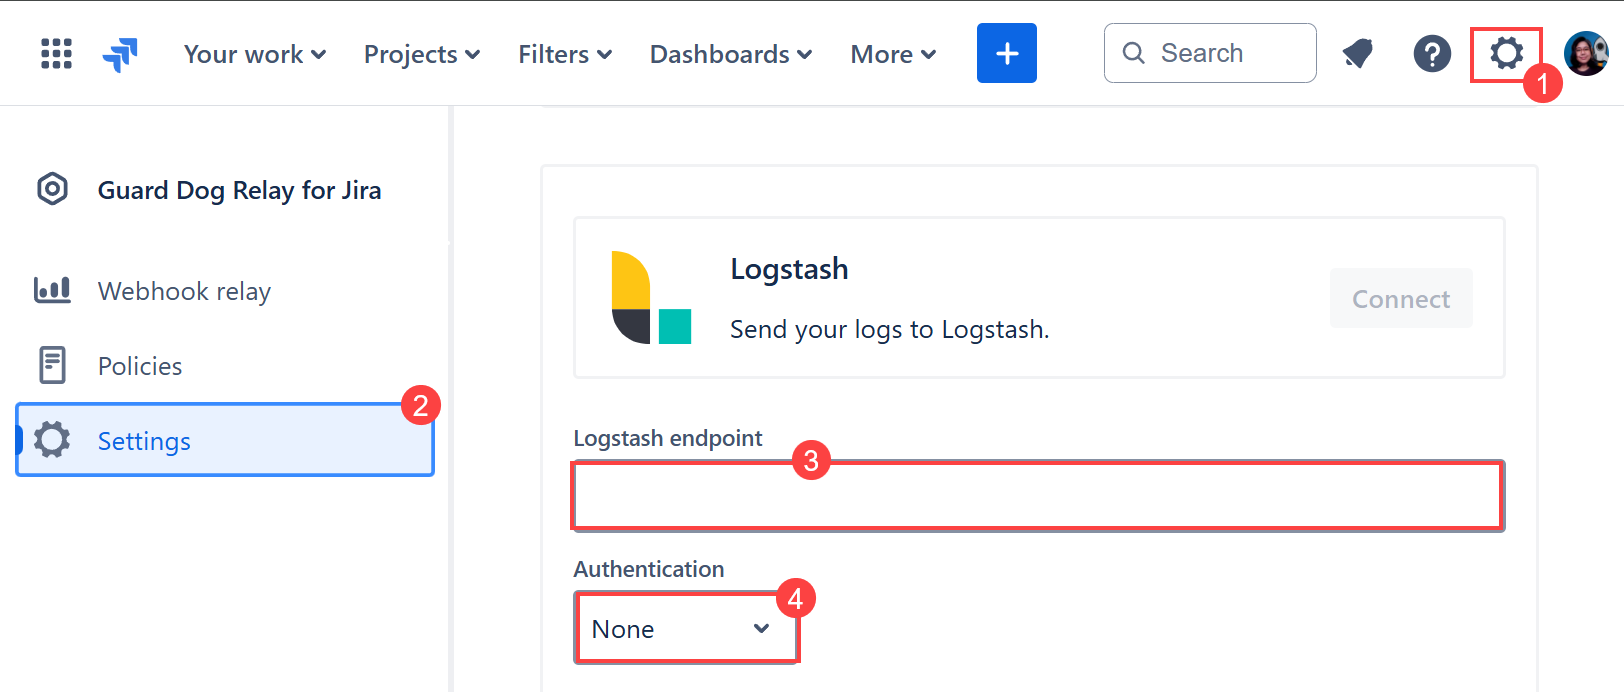
Navigate to Jira top menu ⚙️ Settings > Apps > Guard Dog Relay for Jira.
Click ⚙️ Settings and scroll down to the Logstash section.
Enter the endpoint where your Logstash instance is configured to receive data.
Select the appropriate authentication method (e.g., None, Basic, Bearer) and provide the necessary credentials if applicable.
Testing the integration
Trigger an event.
The example below shows an update on an issue by changing its workflow status.
Further log processing and visualization
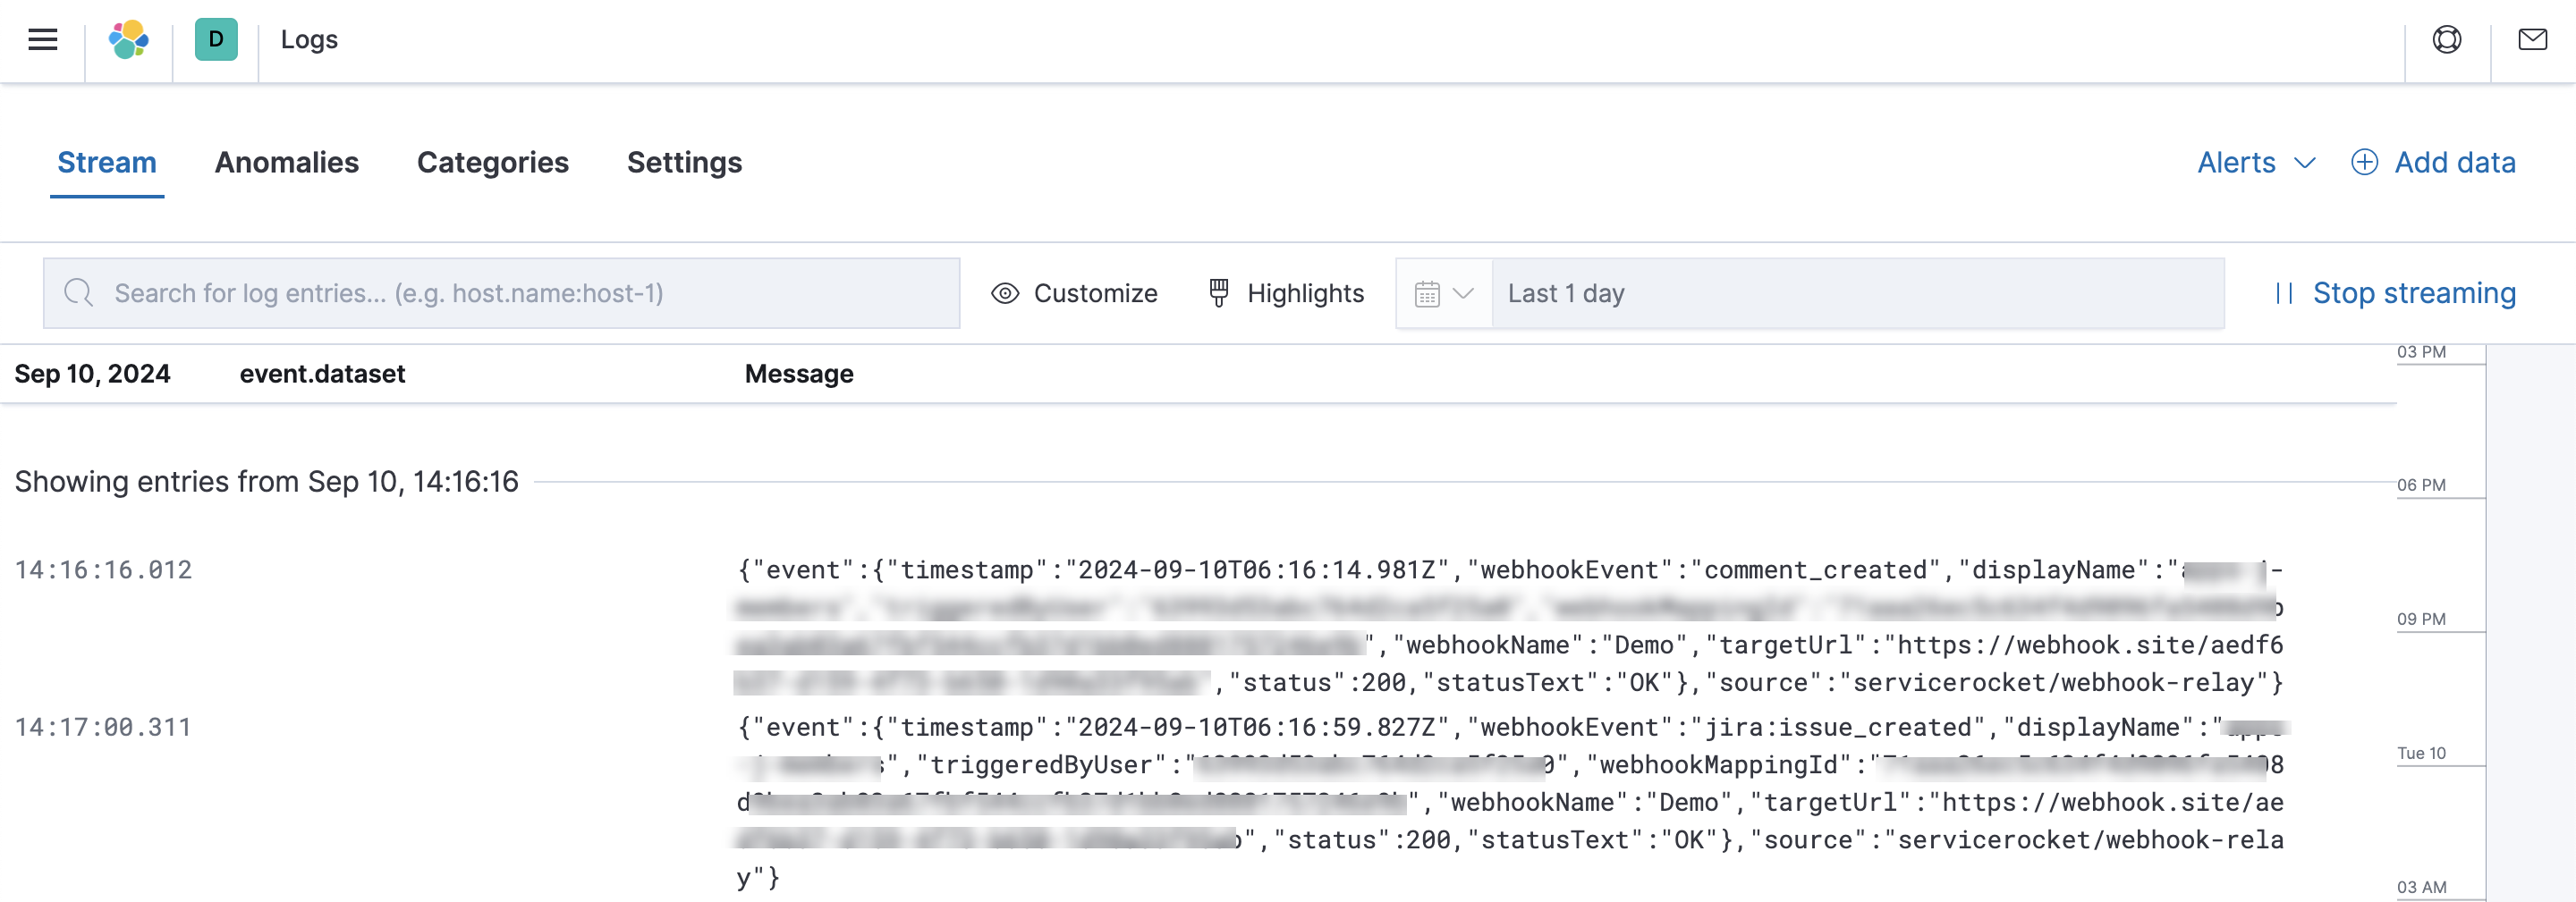
You can use tools like Elasticsearch and Kibana to further process, store, and visualize your data.